Bitcoin Price Prediction: BTC/USD Short-term Bears Target At $46,000

Bitcoin Price Prediction – December 19
The Bitcoin price prediction shows BTC falling after consolidating, but buying interest may pick up if the price approaches $45,000.
BTC/USD Long-term Trend: Bearish (Daily Chart)
Key levels:
Resistance Levels: $52,000, $54,000, $56,000
Support Levels: $43,000, $41,000, $39,000
BTCUSD – Daily Chart
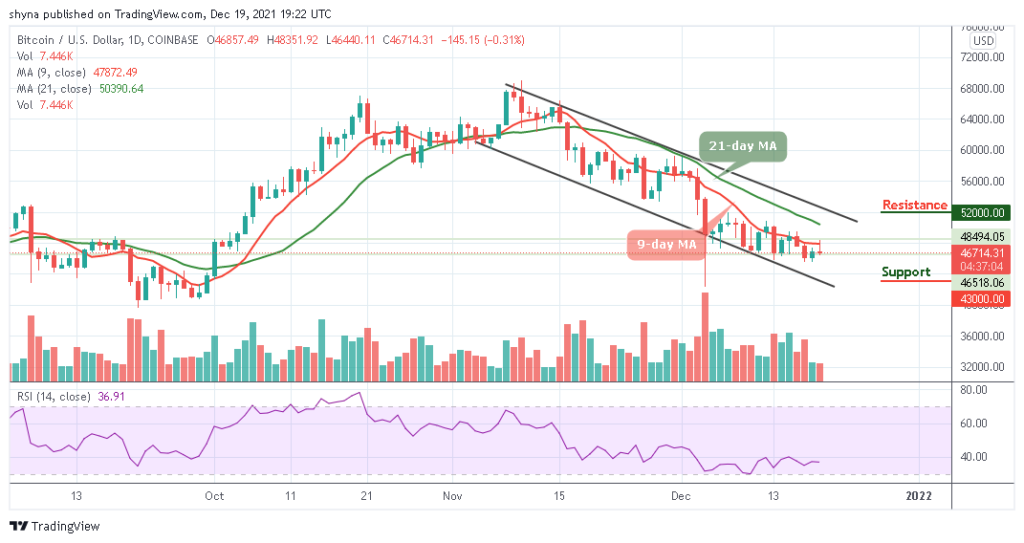
During the European session today, BTC/USD touches the daily high at $48,351 but now dropping below the opening price of $46,857 at the time of writing. However, the psychological barrier of $48,000 still serves as the first important resistance within the market and a sustainable move above 9-day moving average may likely push the price towards the resistance level of $48,000.
Bitcoin Price Prediction: Would Bitcoin (BTC) Stay Beneath?
On the intraday chart, the Bitcoin price breaks below the 9-day moving average, which increases the selling pressure. At the time of writing, BTC/USD is hovering at the support level of $46,714 and if this is cleared, the sell-off may be extended to $44,000 which is around the lower boundary of the channel. Meanwhile, the dips toward the channel are likely to be bought, which means the overall bullish sentiments may prevail.
Moreover, if the price moves below the channel, $44,000 could come into focus which served as a support during the previous consolidation period while the critical supports lie at $43,000, $41,000, and $39,000. Looking at the upside, the first resistance may likely come at $48,000 if the king coin rebounded. Once this is done, $50,000 could come back into focus. Further bullish movement may hit the potential resistance levels at $52,000, $54,000, and $56,000 as the Relative Strength Index (14) remains below 40-level.
BTC/USD Medium-Term Trend: Ranging (4H Chart)
The 4-hour chart reveals that the Bitcoin bears are still within the market keeping the Bitcoin price below the 9-day and 21-day moving averages. Although BTC/USD has not yet slipped below $45,000, it’s still in the loop of making a bounce back.
Moreover, the Bitcoin price is currently hovering below the moving averages at the time of writing. The bulls may likely push the price to the nearest resistance of $48,000 and above while the immediate support lies at $46,000 and below. The Relative Strength Index (14) is likely to cross below 40-level, which indicates a bearish movement.
Looking to buy or trade Bitcoin (BTC) now? Invest at eToro!
68% of retail investor accounts lose money when trading CFDs with this provider
Read more:


