Bitcoin (BTC/USD) Market Loses Momentum

Bitcoin Price Prediction – February 24
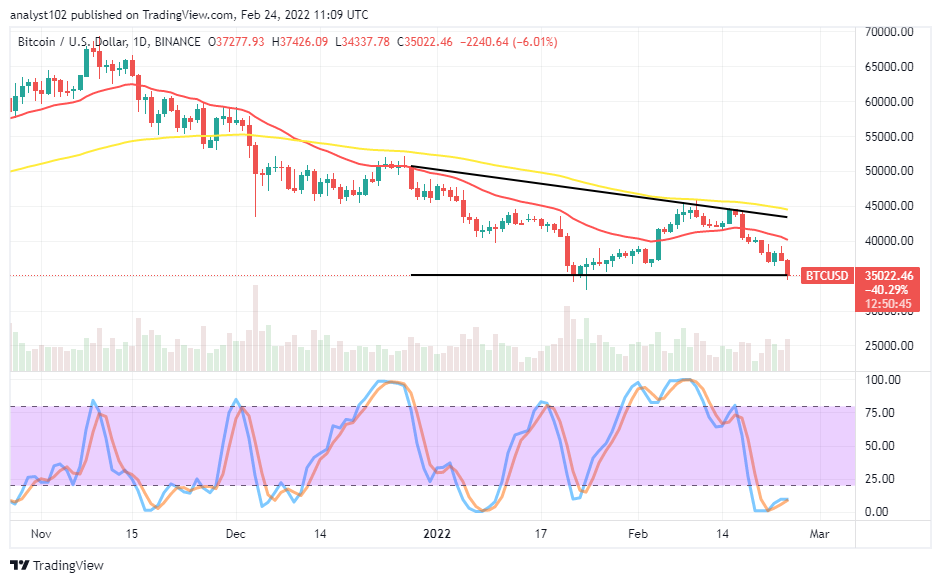
A return of downward-moving pressure has dominated the BTC/USD trading activities over a couple of sessions. Today’s crypto-economic business transaction have initially attained a high of $37,426 and a low of $34,337 as it trades around $35,022 at a negative percentage of 6.01.
BTC/USD Market
Key Levels:
Resistance levels: $37,500, $40,000, $42,500
Support levels: $32,500, $30,000, $27,500
BTC/USD – Daily Chart
The BTC/USD daily chart reveals the crypto-economic market significantly loses momentum over time. The critical trading level of $35,000 has breached southward to denote that the declining force is high intensity. However, the price signifies to regain the catalyst from the depth of that value point. The 14-day SMA indicator is underneath the 50-day SMA indicator. The Stochastic Oscillators are in the oversold region with their lines conjoined and positioned in an attempt to close back southbound within it. That signifies the falling motion is still in place.
As indicated that the BTC/USD market loses momentum to the point below $35,000, is it a good time or chance to start looking for a buy entry?
It also signified that the BTC/USD price is trading in an oversold zone as indicated that the crypto-economic market loses momentum and that situations have portended the need for traders to start thinking of going for a longing order of the crypto economy. The execution of buying orders has to be timely when active motions occur from downward movement beneath or around the $35,000.
On the contrary to the upside technical analysis, the BTC/USD market short-position placers needed to exercise some ethical principles of launching new orders at this point as the downward force appears to be get exhausted in the near time based on the oversold trading situation. If today’s candlestick tends to be a bullish bottom shadow candlestick, the condition could mean some upward forces will have to resume in the days that will come after.
BTC/USD 4-hour Chart
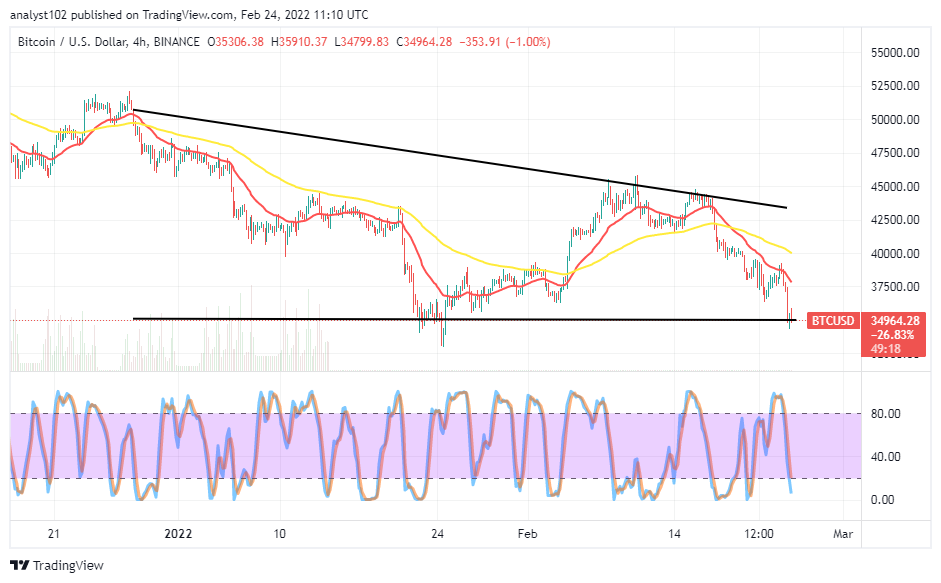
The BTC/USD 4-hour chart reveals the crypto-economic market loses momentum to revisit a lower point below the critical value-line drawn at $35,000. The downward move is featuring for the second time since the commencement of a bearish trading cycle for this year. The 14-day SMA is underneath the 50-day SMA. And they both point toward the south side above the current trading price of the crypto economy. The Stochastic Oscillators are in the oversold region, pointing downward within to indicate the price is yet to find support at a lower trading zone.
Looking to buy or trade Bitcoin (BTC) now? Invest at eToro!
68% of retail investor accounts lose money when trading CFDs with this provider.
Read more:

