Bitcoin Price Prediction for Today, October 7: BTC Stumbles Again After Touching $20,065 Resistance

The Bitcoin price prediction shows that BTC may fall below the 21-day moving average if it touches the support of the $19,000 level.
Bitcoin Prediction Statistics Data:
- Bitcoin price now – $19,455
- Bitcoin market cap – $372.6 billion
- Bitcoin circulating supply – 19.1 million
- Bitcoin total supply – 19.1 million
- Bitcoin Coinmarketcap ranking – #1
BTC/USD Long-term Trend: Bearish (Daily Chart)
Key levels:
Resistance Levels: $23,000, $25,000, $27,000
Support Levels: $17,000, $15,000, $13,000
Your capital is at risk
The daily chart reveals that BTC/USD may claim more support as the king coin moves within the descending channel with the current consolidation pattern. More so, as the coin fails to cross above the upper boundary of the channel, the Bitcoin price may likely see a sharp drop toward the lower boundary of the channel. However, the nearest support may be located at $18,000. Beneath this, other supports could be found at $17,000, $15,000, and $13,000.
Bitcoin Price Prediction: Bitcoin (BTC) May Head to the South
According to the daily chart, the Bitcoin price has failed to break above the resistance level at $20,065, the king coin may set up another few days of negative price declines beneath $19,455. A break above the previous level would have set Bitcoin up to retest the $20,000 level. Meanwhile, the technical indicator Relative Strength Index (14) is crossing below the 50-level, suggesting that the market may head to the south.
Today, the Bitcoin price touches the daily low of $19,325 but now dropping to create another support level below the 9-day and 21-day moving averages. However, it does look like bears may end up closing below this support. On the contrary, if the coin moves toward the upside, resistance levels could be located at $23,000, $25,000, and $27,000.
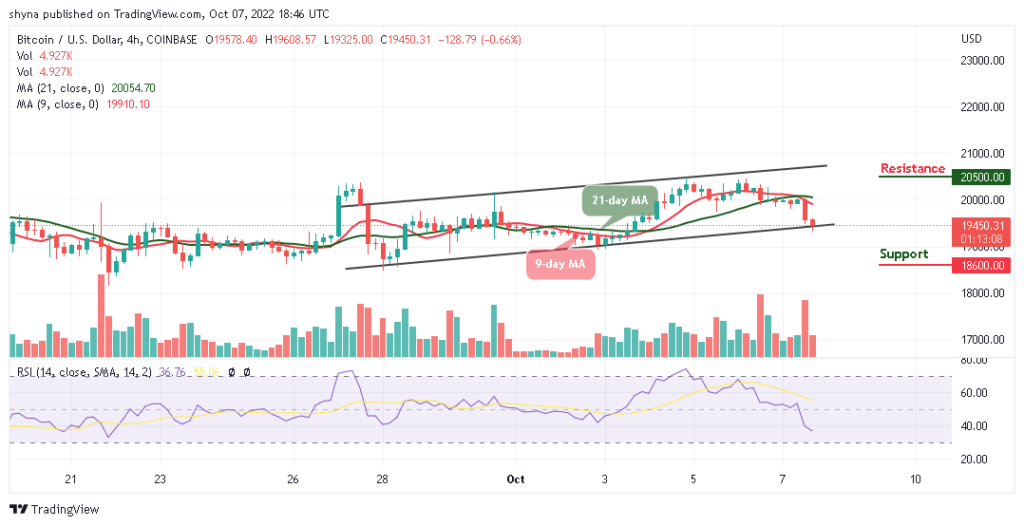
BTC/USD Medium-term Trend: Ranging (4H Chart)
The 4-hour chart shows that the Bitcoin bears are dominating the market by bringing the BTC price to cross below the lower boundary of the channel. Although the Bitcoin price has not yet crossed below the channel, it’s likely to create move downtrends once it breaks below the support level of $19,000.
At the moment, BTC/USD is bearish but any upward movement above the 9-day and 21-day moving averages could push the price to the nearest resistance at $20,500 and above while the immediate support lies at $18,600 and below. The technical indicator Relative Strength Index (14) is crossing below the 40-level, suggesting that bearish signals may come to play.
Tamadoge – Play to Earn Meme Coin
- Earn TAMA in Battles With Doge Pets
- Maximum Supply of 2 Bn, Token Burn
- Now Listed on OKX, Bitmart, Uniswap
- Upcoming Listings on LBank, MEXC

