Bitcoin (BTC/USD) Market Swings Lower in $40,000 and $35,000

Bitcoin Price Prediction – February 22
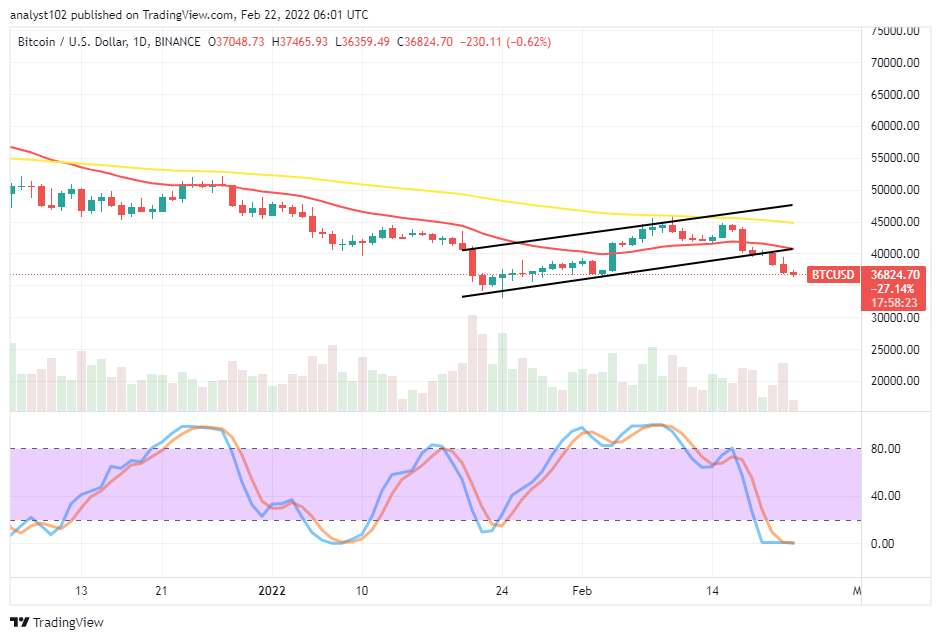
The BTC/USD market swings lower in $40,000 and 435,000 lines as the crypto-economic price keeps journeying to the downside in a slow-and-steady manner. The trading activities have witnessed a high and a low of $37,465 and $36,359 at a minute negative percentage of 0.62.
BTC/USD Market
Key Levels:
Resistance levels: $40,000, $42,500, $45,000
Support levels: $35,000, $32,500, $30,000
BTC/USD – Daily Chart
The BTC/USD daily chart showcases the crypto-economic market swings lower in $40,000 and $35,000 as the bearish trend appears to have resumed, having broken down at the higher value-line mentioned earlier. The 14-day SMA indicator is underneath the 50-day SMA indicator. The Stochastic Oscillators are in the oversold region, attempting to consolidate. That could mean that the bearish trend will have to stay longer if the indicator’s reading is genuine.
Will BTC/USD price hold firmer furthermore in its current bearish session as the market swings lower in $40,000 and $35,000?
The BTC/USD price may hold firmer furthermore in its current bearish session as the market swings lower in $40,000 and $35,000 levels. The situation has not had a tangible signal against the downward-moving status to reliably count upon a bullish motion returning process as of now. A rebound can occur in no time by featuring a daily bullish candlestick engulfing some penultimate afterward, and then, the subsequent sessions are liable to see more ups returning.
On the downside of the technical analysis, the BTC/USD market short-position placers have to exercise some precautionary steps in exerting a sell order at this point. But, the previously opened positions may still leave to run more for a while until a full-fledged bullish candlestick formed at a lower-trading spot to exit their sell positions opened. A breakdown of the $35,000 could lead to bears profiteering. And that could also cause bears’ trap.
BTC/USD 4-hour Chart
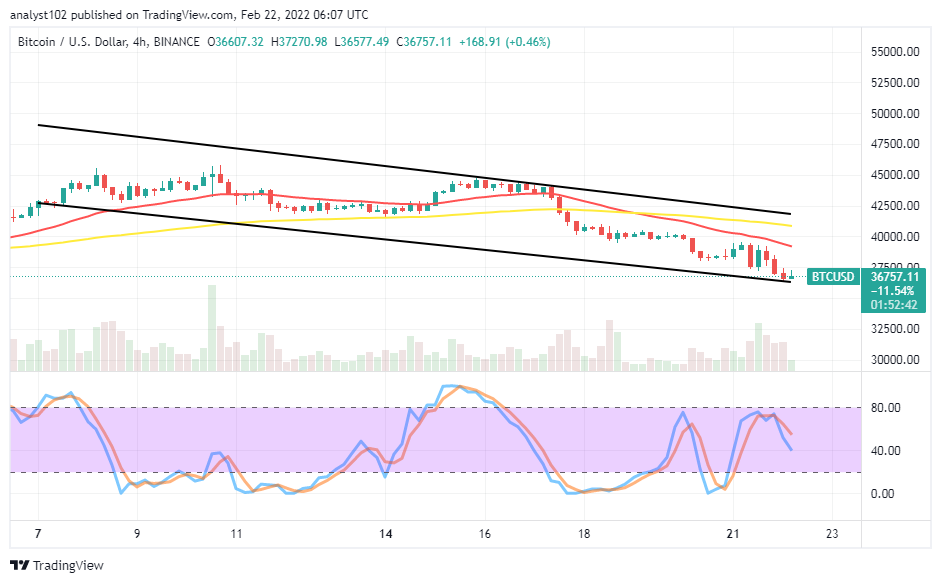
The BTC/USD 4-hour chart shows the crypto-economic pricing activities move in a bearish trend outlook. The market swings lower in $40,000 and $35,000 trading levels. The lesser value-line has averaged as prices seem to consolidate their stances around the lower bearish trend line drawn. The Stochastic Oscillators have crossed their lines southbound from the range of 80 to touch the range at 40. That signifies that a falling force is in place. Therefore, the longing of orders may suspend for a while to get a pattern that will portend a return of upswings to start taking actions in line with such presumed change of direction.
Looking to buy or trade Bitcoin (BTC) now? Invest at eToro!
68% of retail investor accounts lose money when trading CFDs with this provider.
Read more:

