Bitcoin Price Prediction: Crucial Pattern Spells Doom, $56K Vital For BTC

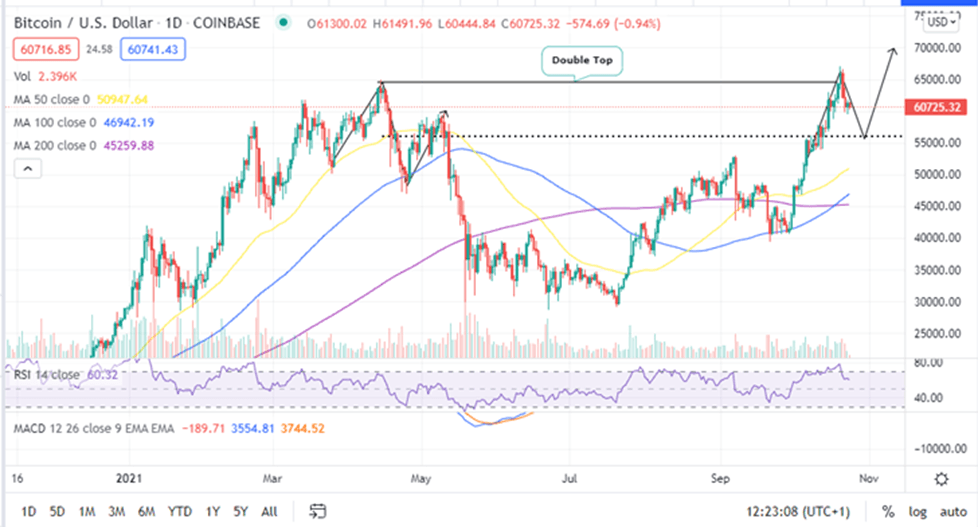
- Bitcoin price action looks scary as it spells out a double-top pattern on the daily chart.
- The largest cryptocurrency is now exposed to a downside target of $56, 000.
- IntoTheBlock’s IOMAP model suggests that the BTC is sitting on strong support around the $56,000 support zone.
Bitcoin price is currently exchanging hands 9% lower than the recently recorded all-time high (ATH) above $67,000. Retracement appears quick and sharp as seen on the daily chart probably due to seller congestion near the ATH. It could also be that investors took advantage of the recent bull run that the crypto market has experienced since the beginning of “Uptober” to collect their profits.
At the time of writing, BTC was trading at $60,725 while sitting on immediate support around $59,900. Note that a daily closure below this level will see the Bitcoin price breakout downwards as sellers target $56,000.
Bitcoin Price Could Tank To $56K If Key Technical Pattern Holds
BTC appears to be forming a double-top pattern on the daily chart after being recording the ATH at around $67,276. A double-top is an exceptionally bearish chart pattern that often results in a trend reversal.
67% of retail investor accounts lose money when trading CFDs with this provider
Read More


